Background
In the past, visibility into database availability and metrics was split into two parts: a series of centralized monitor hosts which would connect to each database host and run a dummy query to check for availability each minute, and a series of monitor scripts, deployed as part of a larger database management application, scheduled to run each minute via cronjob.
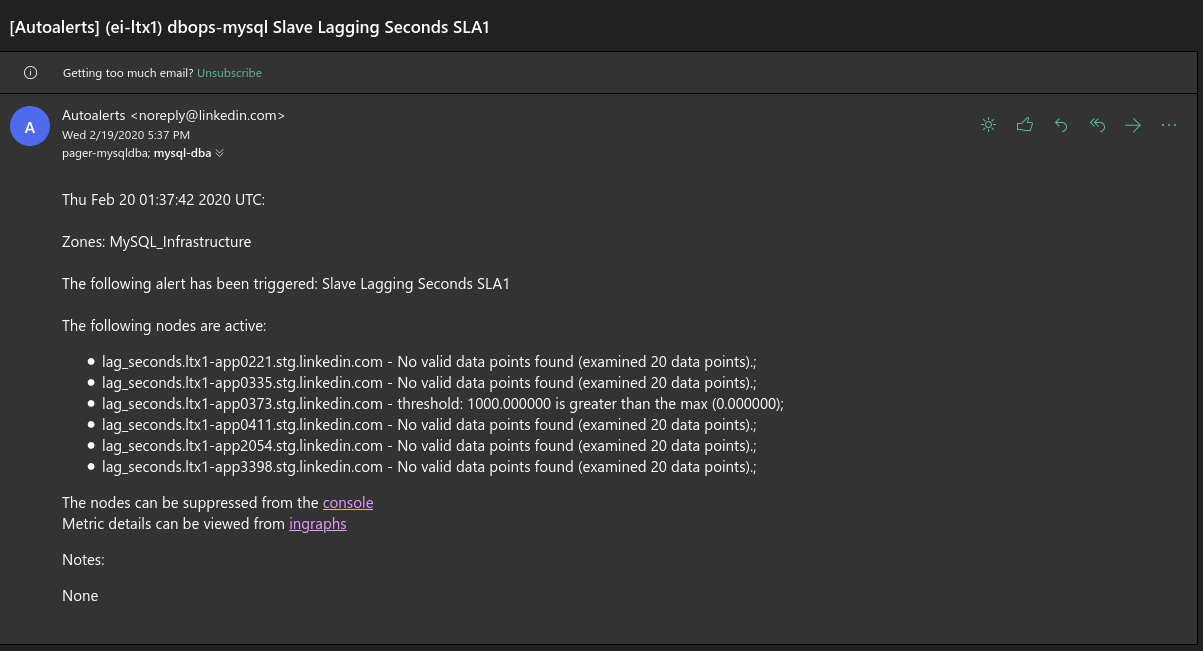
Monitoring was done by utilizing a built-in alerting framework against the metrics which were posted to an upstream service, sending an alert if pre-defined thresholds were breached.
This approach had many limitations:
- The monitoring scripts often crashed without proper error logs, resulting in alerting false positives. We had limited ability to catch them prior to deploying them due to lack of unit testing in the application.
-
The alerts sent via the built-in framework were generic to a fault, simply warning that a threshold for a specific metric was breached or missing, without any additional context or instructions to resolve the issue.
- The centralized monitor hosts were single points of failure; if the availability script didn't run during a minute for any reason, it would be reported as a mass availability outage across all databases in the datacenter.
- The availability script was single-threaded and O(n); as more database hosts were added to a datacenter, the script would take longer to complete.
- Alerts often had dependencies on each other; we had a few well-known patterns where, if something went wrong on a database host, we expected multiple alerts to fire at once.
- We had limited control over the alerts sent via the alerting framework; as examples, alerts were often queued to be sent up to 5 minutes after an issue surfaced in a host, and alerts which were suppressed often spontaneously unsuppressed themselves for one minute before suppressing themselves again.
- In the event of maintenance, we had no functionality to preemptively suppress all alerting for a host en masse. The solution at the time was to warn the oncall for the flood of alerts that would soon arrive prior to maintenance.
Assertions
All monitoring and alerting functionality was isolated into individual checks, subject to the following rules:
- Checks should be isolated from other operational functionality.
- Checks should run independently from one another.
- Checks should be written in a clear, consistent format.
- Checks should have unit tests written against them.
- All checks should run consistently every minute, and all should complete within 1 minute.
All control on alerting would be subject to the following rules:
- If an alert is sent, an oncall should receive it within seconds.
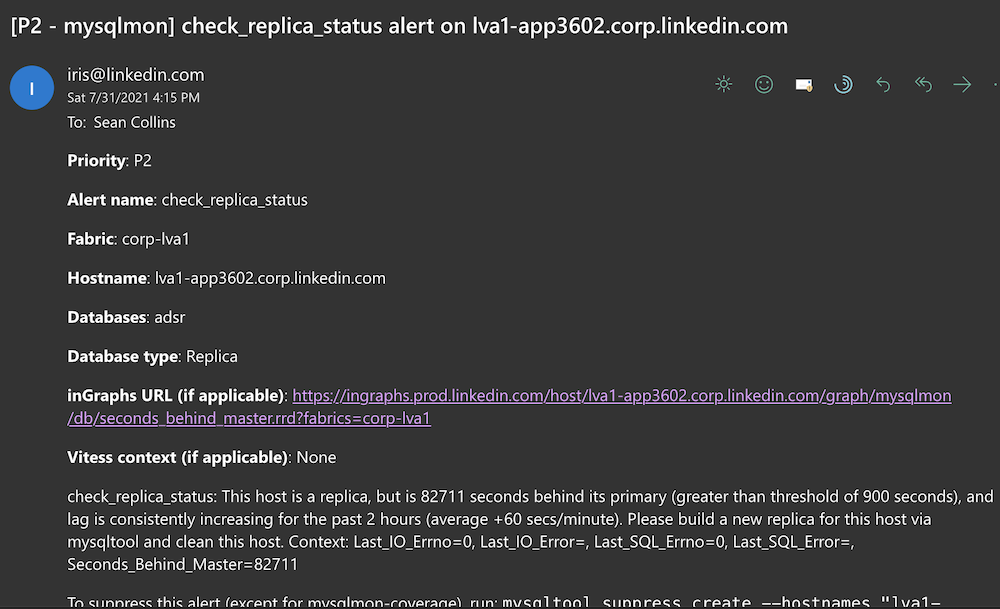
- Alerts should contain a clear description of what went wrong, clear context behind the issue, clear instructions as to what the oncall should do next, and clear instructions as to how the oncall can suppress the alerts.
- Alerts should be able to be suppressed at any time, including prior to maintenance, at the alert level, host level, or datacenter level.
Design
I designed a monitoring agent, mysqlmon, to hold all possible checks which could be performed on a host. All checks were required to confirm to a particular code pattern and were required to have unit tests. This requirement was enforced via another unit test, which would fail if a new check wasn't written in such a manner.
To strictly enforce metrics being emitted every minute, all checks were run concurrently as individual processes, with an external watcher responsible for killing any process which did not complete within 45 seconds. Most processes completed within a few milliseconds, with a full suite of checks completing within an average of 10 seconds.
All alerts were designed to be sent via a customized template, providing substantially more context to the oncall to take action.
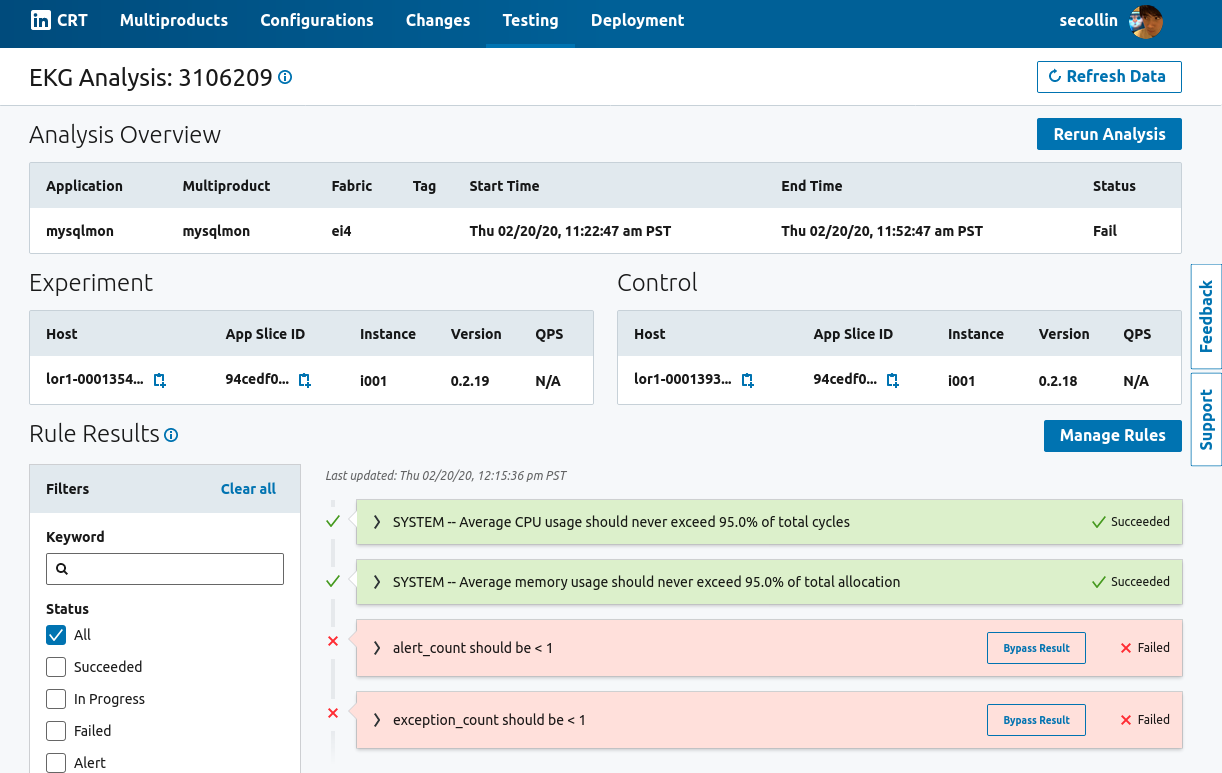
Upon rollout of a change to the alerting agent, the change would be canaried against a subset of hosts in each datacenter, and automatically promoted to the rest of the fleet if a set of pre-defined rules passed, or rolled back if they failed.
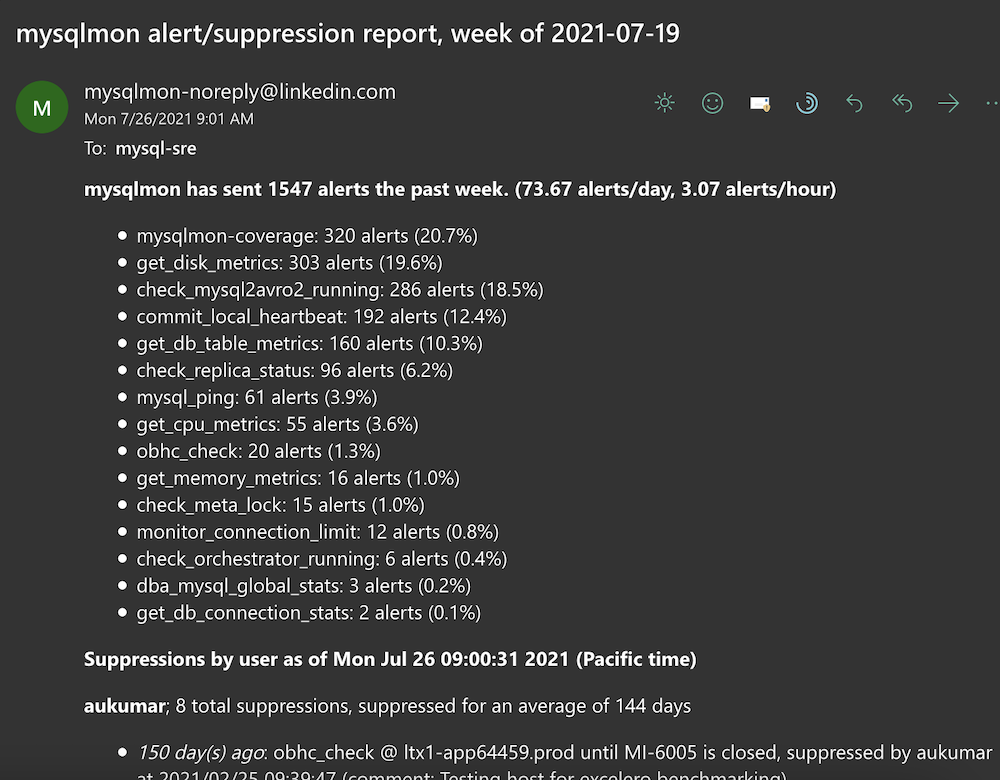
For checks which couldn't be performed on the host -- for example, agent availability (which would be affected if the host went down) -- a service would sit in each datacenter, named mysqlmon-master. The service would be responsible for monitoring availability of the individual agents on the hosts, managing alert suppressions created by the team, as well as exposing analytics regarding alerting and suppressions for review at a later time.
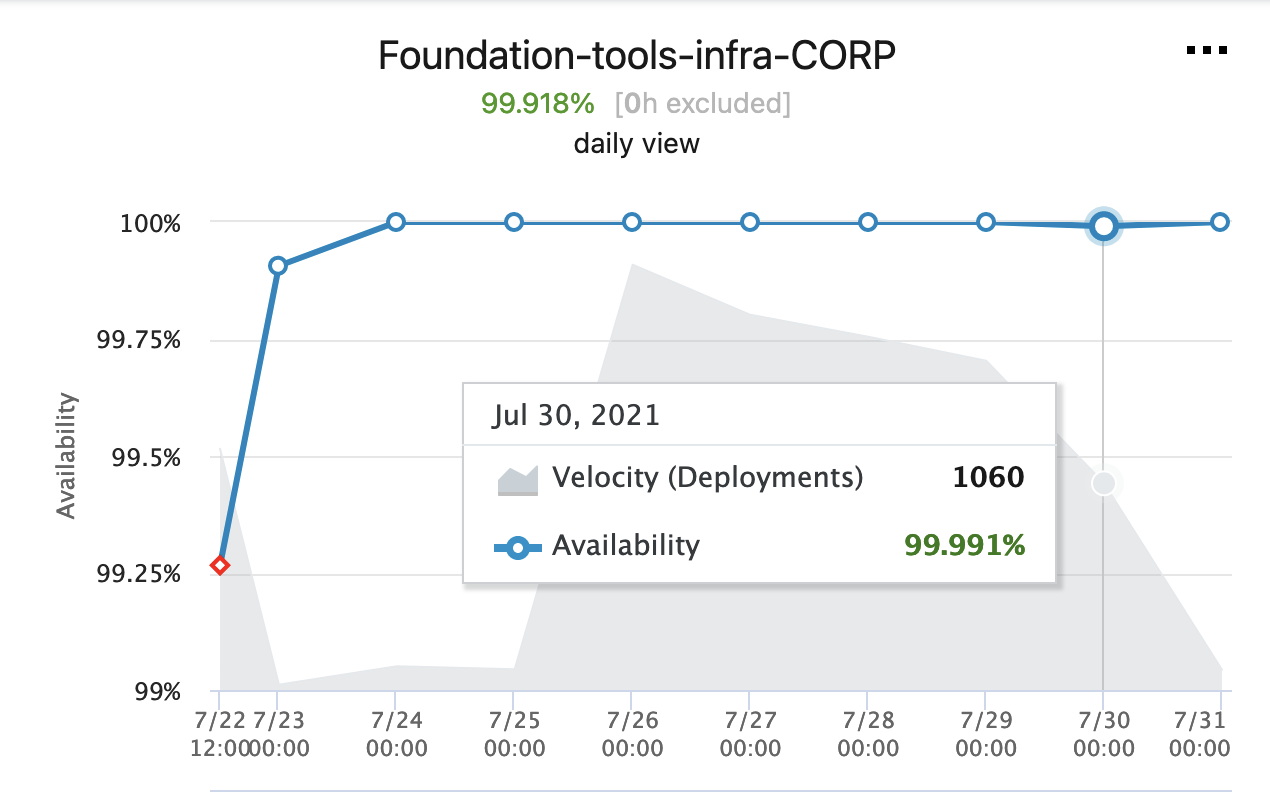
Availability metrics were emitted to a standard location in a standard format, which allowed a live availability breakdown by service to be exposed to external teams.
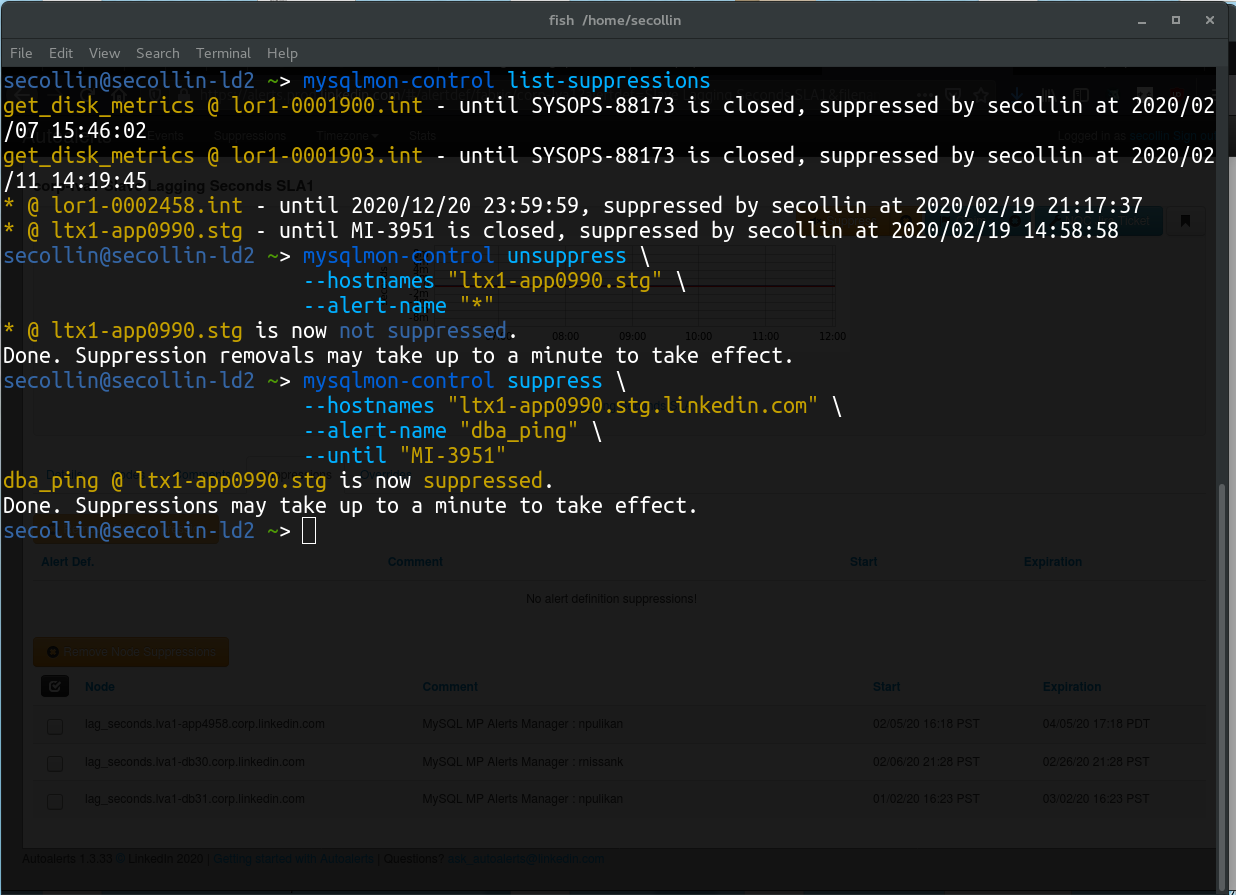
An API on mysqlmon-master was exposed to manage suppressions, allowing any piece of automation to manage alert suppressions if performing an operation expected to produce alerts. A CLI tool distributed to the team was also created to easily create suppressions from the terminal. (This functionality was later rolled into mysqltool, also described in detail elsewhere on my portfolio.)
mysqlmon-master was deployed as a set of three in each datacenter, loadbalanced behind a single service name. A failure in one host would result in automatic failover to another within the same datacenter with no loss in service availability. A failure in a datacenter would surface as an alert from an external alerting service to the oncall, who could then respond by failing over the service to another datacenter.
Result
The release initially resulted in an increase in overall alert volume sent to the team, due to many identified gaps in alerting from the previous solution being surfaced. However, alert volume has been steadily decreasing (from an average of 1500+ alerts sent per week to an average of less than 1000 between August 2020 and August 2021), likely as a result of alerting and suppression analytics being exposed for weekly review. Time spent determining the root cause of each alert was greatly reduced, from several minutes to only a few seconds.
A few months after initial release, all existing monitoring solutions were decommissioned.
Metrics sent by mysqlmon were distributed publicly to external teams, to reduce engagement of our oncall for context behind any issues on the database side.
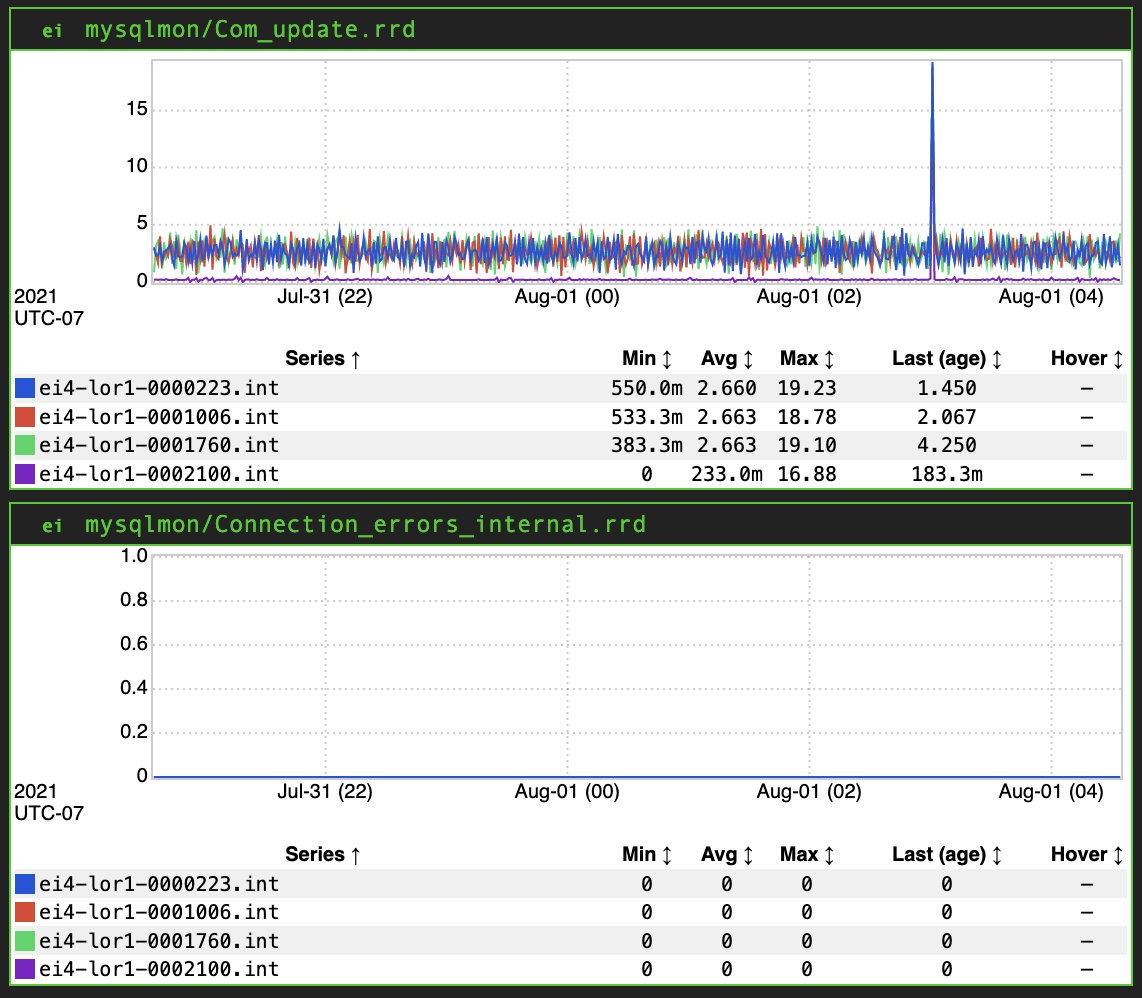
The following year, alerting and suppression management compatible with mysqlmon and mysqlmon suppressions began to be integrated to other automation outside of the agent, and work began to integrate autoremediation of certain alert patterns into mysqlmon.
